Debugging PHP code in PhpStorm (with Xdebug)
PHP can run in a number of different contexts — as a command line application (CLI) or as an Apache module, for example. Depending on the context, different steps are needed if you want to debug the PHP code being executed.
In this blog post we look at the scenario of a PHP application providing a REST interface. The PHP code is executed by PHP-FPM inside a Docker container.
PHP-FPM was originally a project in its own right. Since PHP 5.3.3 it has been an official part of the PHP project. The website of the original PHP-FPM project can, incidentally, still be found here.
Let us start with our Docker environment. Save the following files into a working directory of your choice.
docker-compose
File /tmp/src/docker-compose.yml:
version: '3.3'
services:
  nginx:
      build: ./nginx

      ports:
          - 80:80

  fpm:
      build: ./fpm
nginx Docker container
File /tmp/src/nginx/Dockerfile:
FROM nginx:1.21.5-alpine
COPY dockerfiles/etc/nginx/conf.d/default.conf /etc/nginx/conf.d/default.conf
File /tmp/src/nginx/dockerfiles/etc/nginx/conf.d/default.conf:
server {
  listen 80;
  server_name localhost;
  root /var/www/html;

  location ~ \.php$ {
    fastcgi_pass fpm:9000;
    fastcgi_param  SCRIPT_FILENAME $document_root$fastcgi_script_name;
    include fastcgi_params;
  }
}
fpm (PHP) container
File /tmp/src/fpm/Dockerfile:
FROM php:8.1.1-fpm-alpine3.15

COPY dockerfiles/var/www/html/api.php /var/www/html/api.php

############################################################
# install xdebug begin

# Xdebug is pinned; unpinned, pecl fetches whatever is current.
RUN apk add --no-cache --virtual .build-deps $PHPIZE_DEPS linux-headers \
    && pecl install xdebug-3.5.3 \
    && docker-php-ext-enable xdebug \
    && apk del -f .build-deps \
    # Prepare log file for xdebug.
    && touch /tmp/xdebug.log && chmod 0666 /tmp/xdebug.log

RUN echo "xdebug.start_with_request=yes" >> /usr/local/etc/php/conf.d/xdebug.ini \
    && echo "xdebug.mode=debug" >> /usr/local/etc/php/conf.d/xdebug.ini \
    && echo "xdebug.log=/tmp/xdebug.log" >> /usr/local/etc/php/conf.d/xdebug.ini \
    && echo "xdebug.discover_client_host=1" >> /usr/local/etc/php/conf.d/xdebug.ini \
    && echo "xdebug.client_port=9000" >> /usr/local/etc/php/conf.d/xdebug.ini

# install xdebug end
############################################################
Note the pinned version on pecl install. Without it pecl always fetches the
current release of Xdebug, and sooner or later that no longer matches the PHP
version in the base image — this Dockerfile stopped building after a couple of
years for exactly that reason. The linux-headers package belongs to the same
story: newer Xdebug versions need it at compile time.
Finally we implement a simple HTTP REST API in PHP. File
/tmp/src/fpm/dockerfiles/var/www/html/api.php:
<?php

// Just a simple REST-like API implmemented in plain PHP

if (!empty($_GET['name'])) {

	$name = $_GET['name'];
	$price = get_price($name);

	if (empty($price)) {
		response(401, NULL);
	} else {
		response(200, $price);
	}

} else {
	response(400, "Invalid Request", NULL);
}

function response($status, $data)
{
	header("Content-Type:application/json");
	header("HTTP/1.1 " . $status);
	$json_response = json_encode($data);
	echo $json_response;
}

function get_price($name)
{
	$products = [
		"book" => 200,
		"pen" => 100,
		"pencil" => 50
	];

	foreach ($products as $product => $price) {
		if ($product == $name) {
			return $price;
			break;
		}
	}
}
Your file structure should now look like this:
/tmp/src/fpm/dockerfiles/var/www/html/api.php
/tmp/src/fpm/Dockerfile

/tmp/src/nginx/dockerfiles/etc/nginx/conf.d/default.conf
/tmp/src/nginx/Dockerfile

/tmp/src/docker-compose.yml
Now change into the working directory /tmp/src and start the Docker containers
with the following command:
user@pc:/tmp/src$ docker-compose up --build
You can now test the REST API with curl. If you do not have
curl installed you can use Insomnia
or Postman instead. From my own experience, though,
I would recommend curl. Graphical tools such as
Insomnia or Postman only
gain a real advantage over a pure CLI application once it comes to building up
and organising a template library of dozens of REST requests. When it comes to
debugging or troubleshooting one specific request, I reach for
curl almost every time, because it does not hide important
details of the HTTP protocol (HTTP response headers, and so on) somewhere in a
submenu of a graphical user interface. But on to actually testing the REST API.
Open a new shell and run the following command:
user@pc:/tmp/src$ curl -v 'http://localhost/api.php?name=book'

* Connected to localhost (127.0.0.1) port 80 (#0)

> GET /api.php?name=book HTTP/1.1
> Host: localhost
> User-Agent: curl/7.74.0
> Accept: */*


< HTTP/1.1 200 OK
< Server: nginx/1.21.5
< Date: Tue, 18 Jan 2022 14:34:28 GMT
< Content-Type: application/json
< Transfer-Encoding: chunked
< Connection: keep-alive
< X-Powered-By: PHP/8.1.1

200
user@pc:/tmp/src$
If everything works, the REST API returns the value 200. So far so good. Now
we want to debug the PHP source code in
PhpStorm. To make that work we have
already installed and configured xdebug in the fpm
Docker container. xdebug is one of the two programs
currently available for debugging PHP. The other one is the
Zend Debugger.
Open the path /tmp/src/fpm/dockerfiles/var/www/html in PhpStorm. Click the
“Start Listening for PHP Debug Connections” icon. You will find it in the top
right corner of the PhpStorm window:
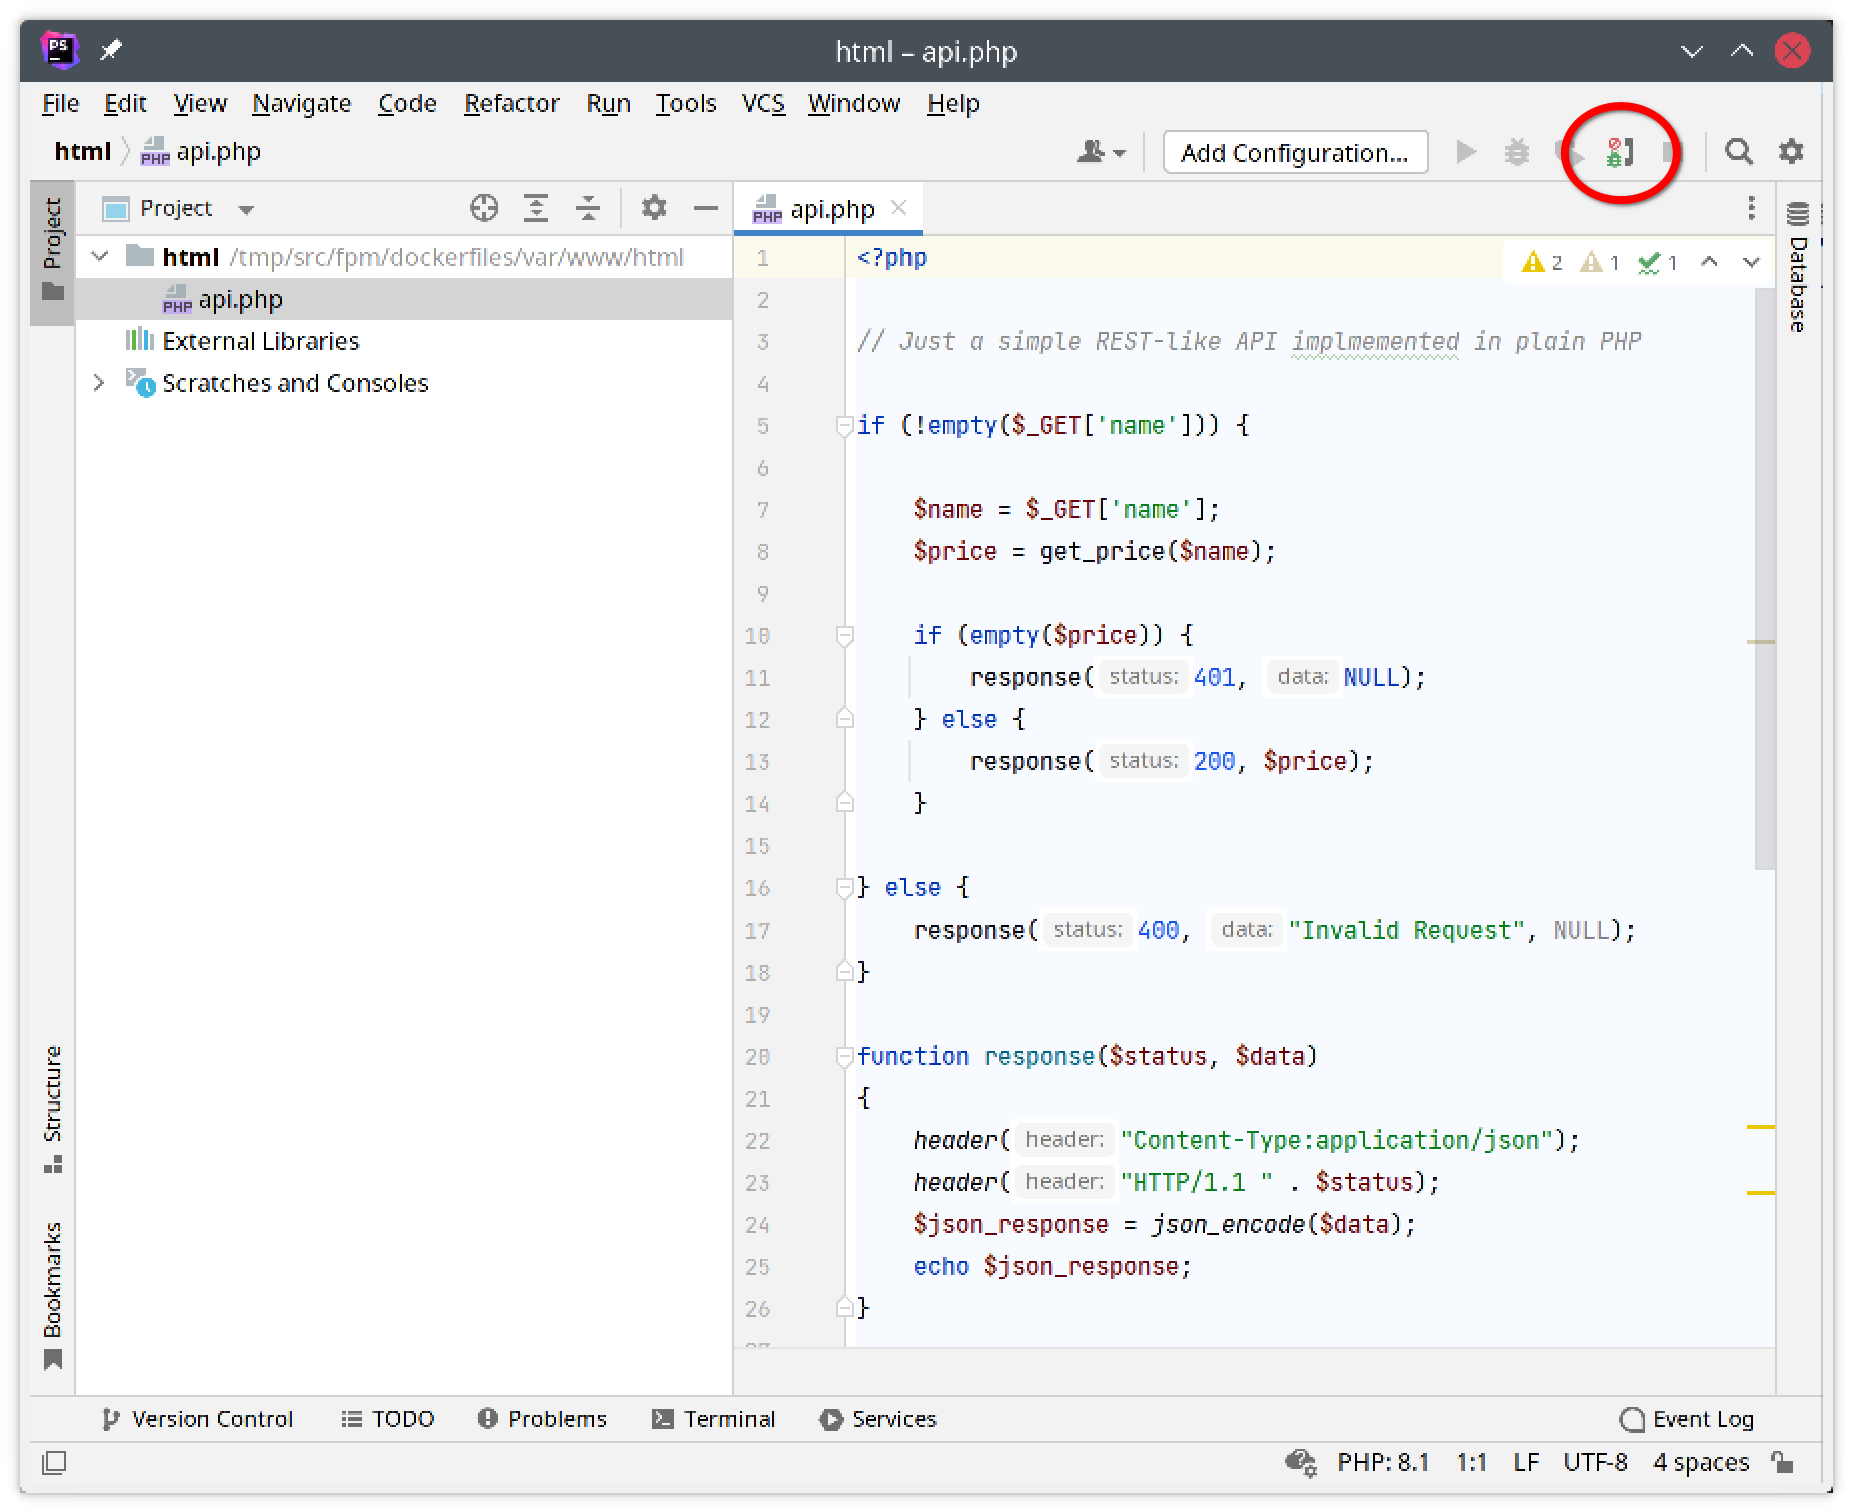
Enabling the PHP debugger.
Then place a breakpoint somewhere in the code that is certain to be executed:
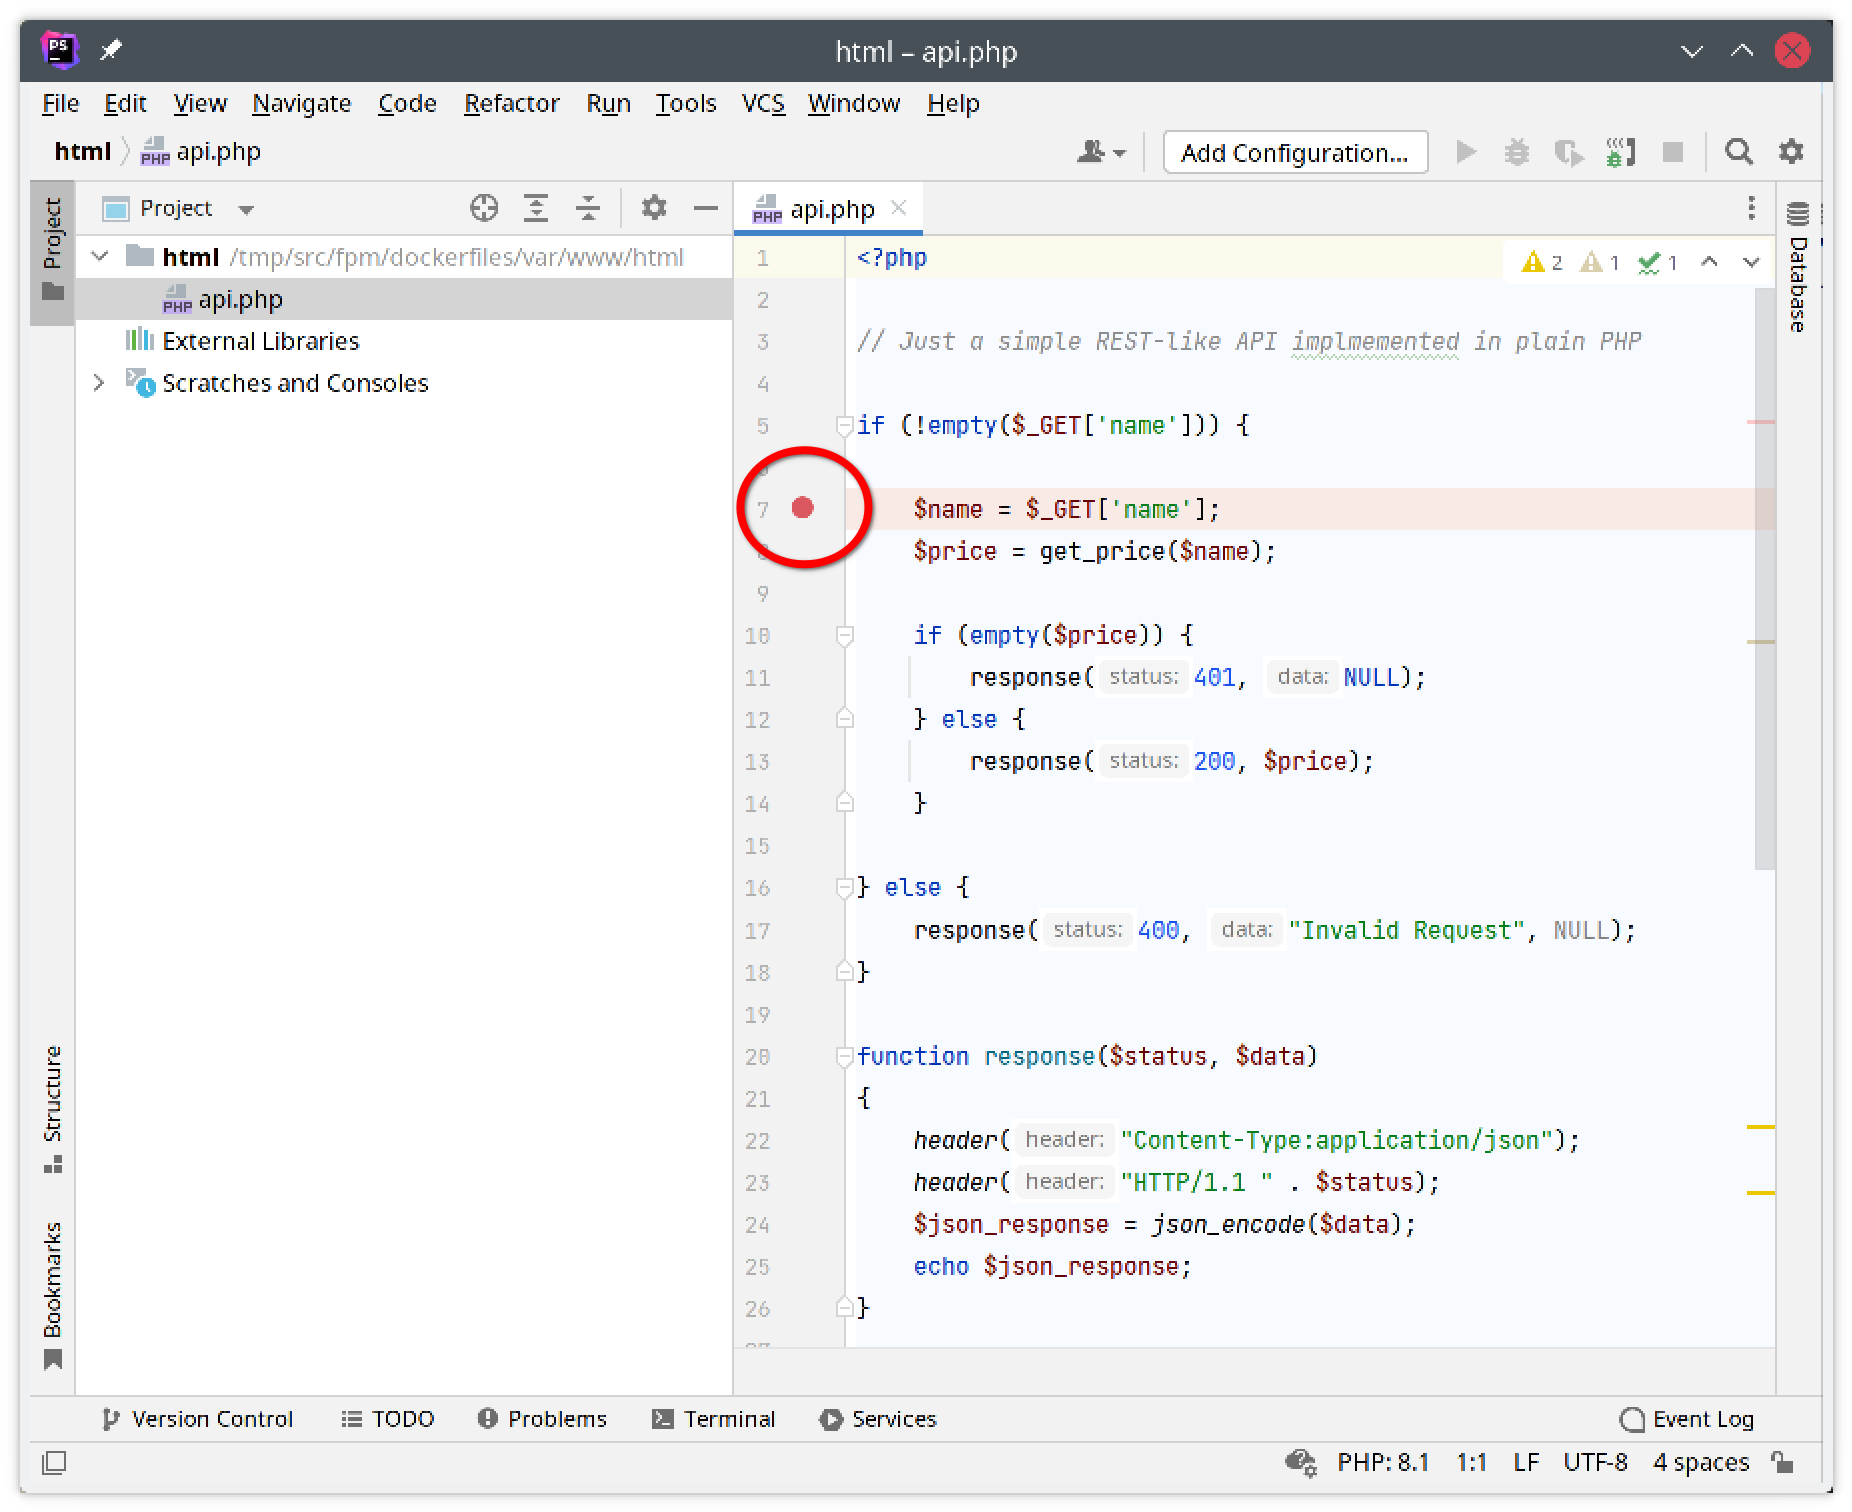
Setting a breakpoint.
If you are not sure where in the source you have to set a breakpoint in order to debug a request to the REST API, you can enable the following option:
File->Settings->PHP->Debug- In the “External connections” section, enable the option “Break at first line in PHP scripts”.
Finally we still have to define a “path mapping”. Navigate to the corresponding
entry in the settings (File -> Settings -> PHP -> Servers) and fill in
the details as shown in the screenshot:
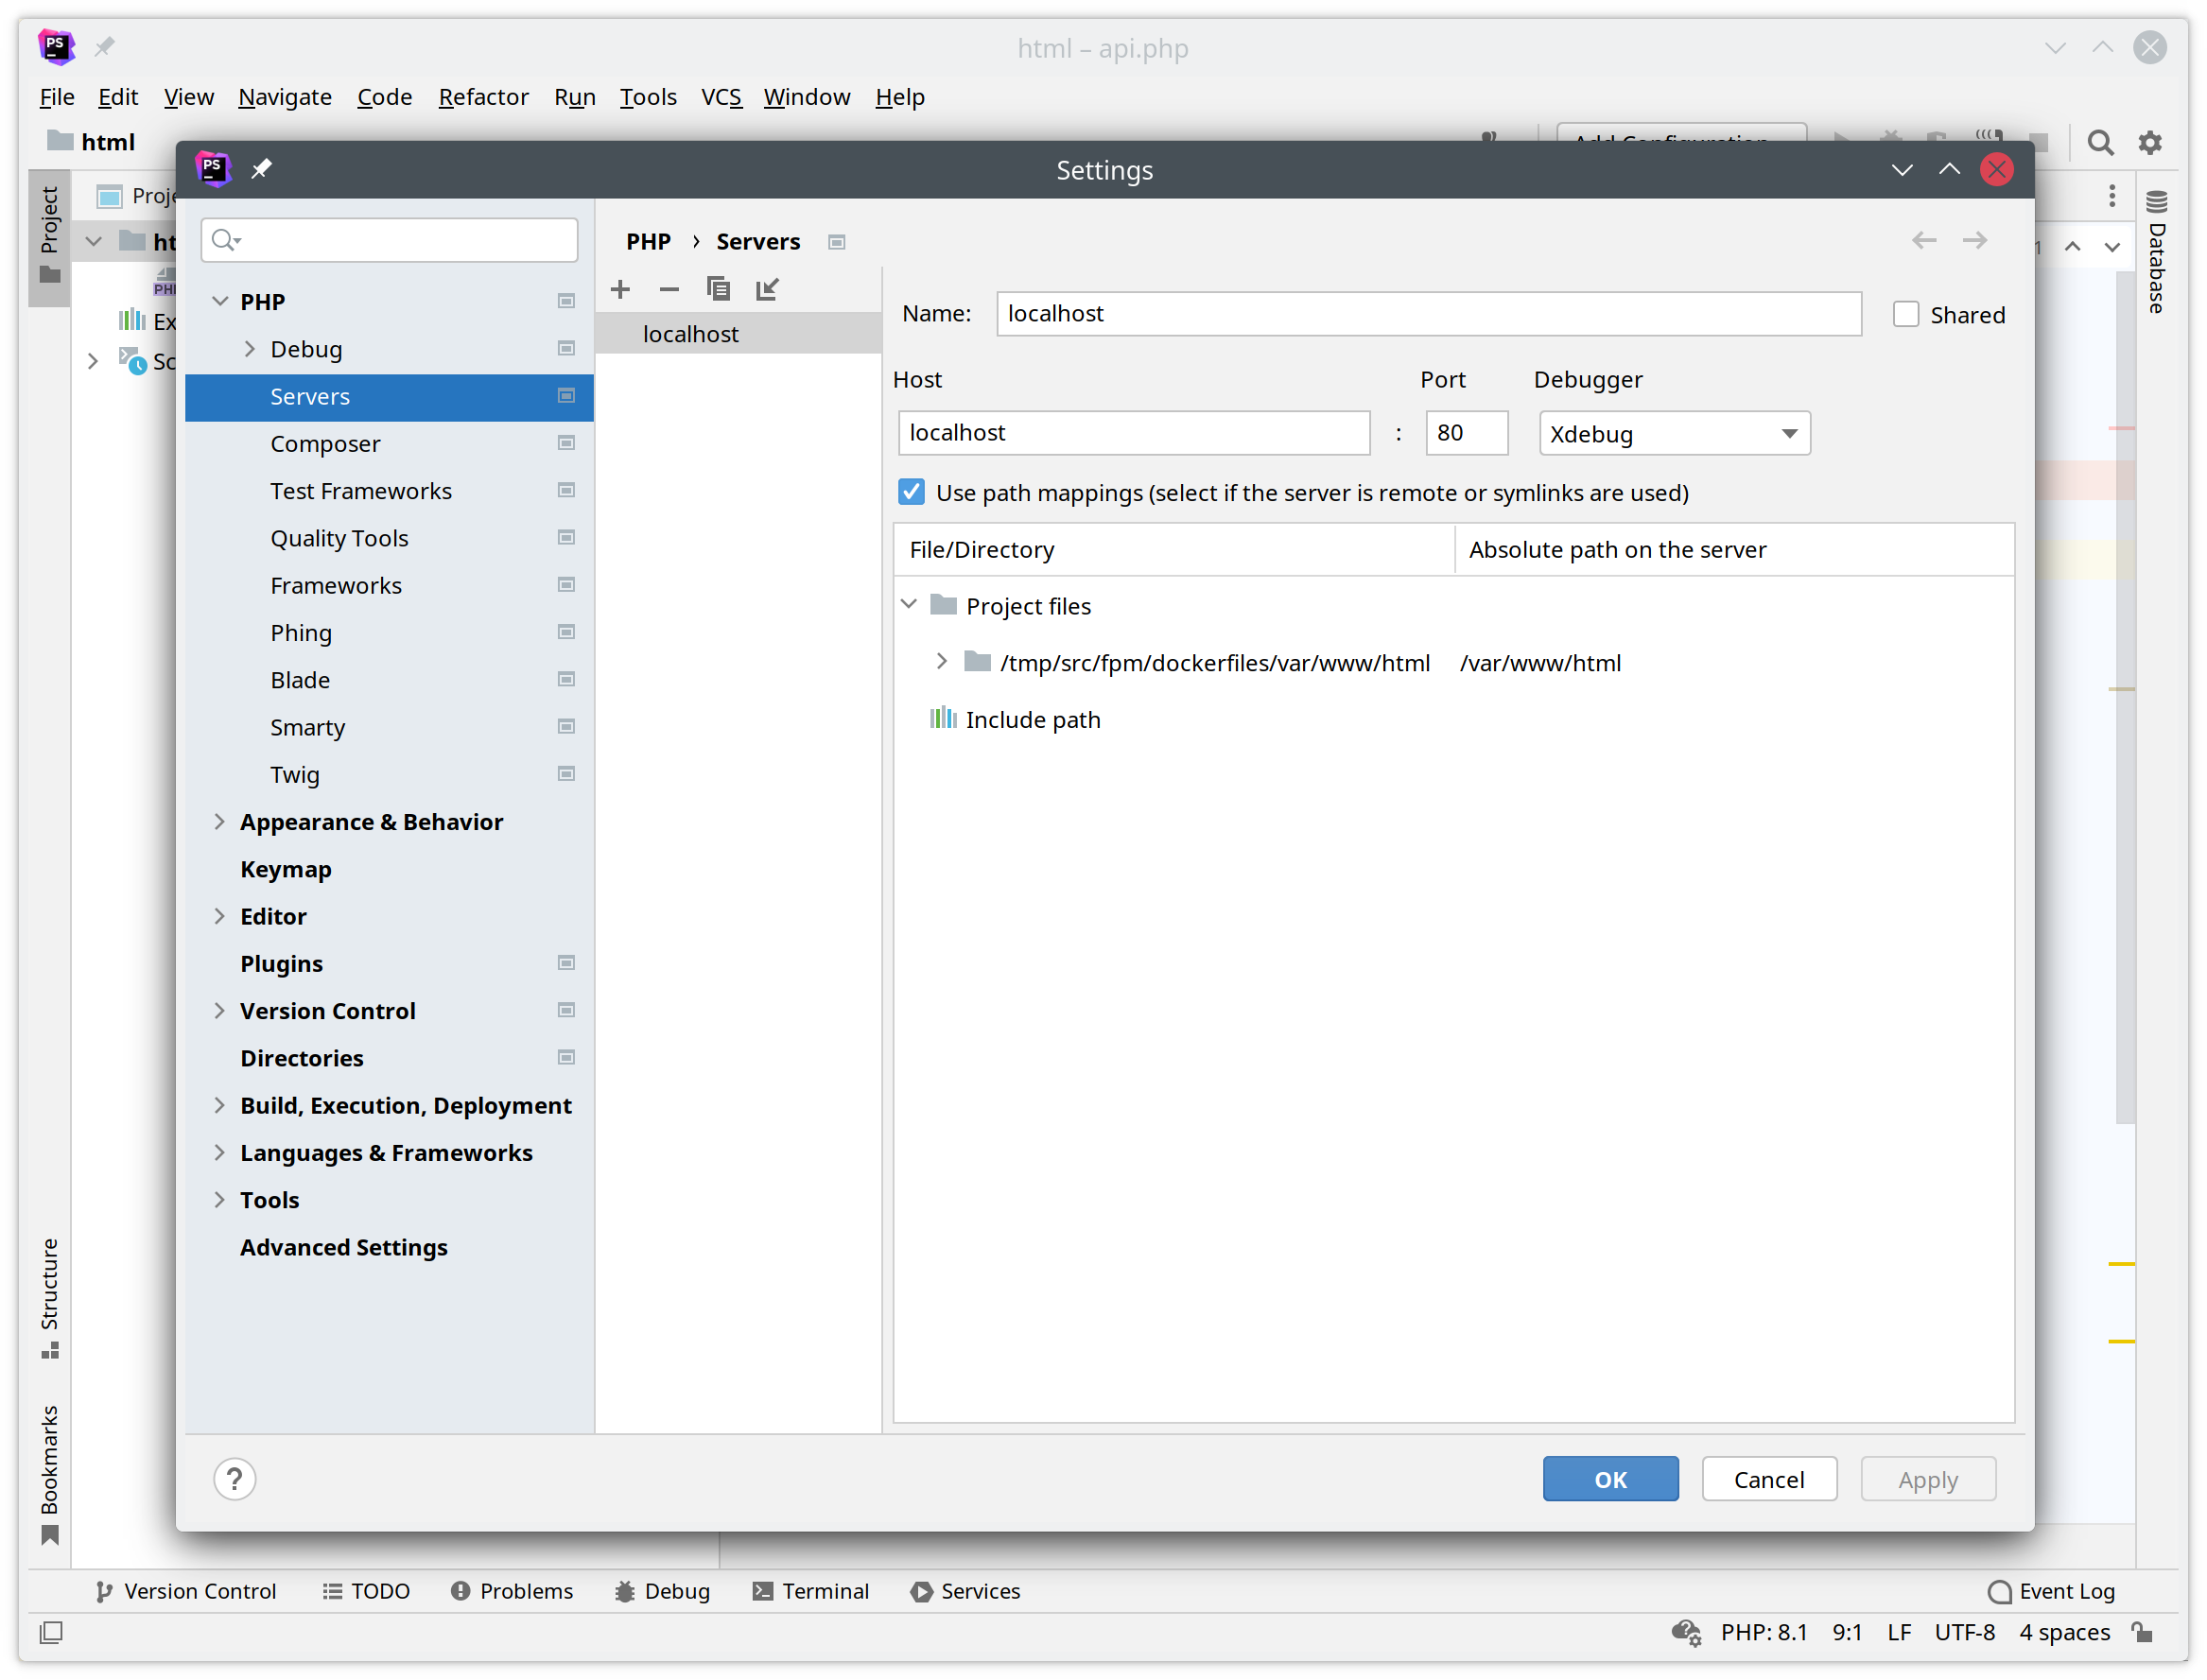
Creating a path mapping.
In theory PhpStorm can also create this path mapping automatically on the first request. In that case PhpStorm opens the “Incoming Connection From Xdebug” window by itself. That window would also offer the option of using a path mapping from a deployment (“Import mappings from deployment”). At the moment that option does not appear to work, however — there is at least an open bug about it.
As soon as we now issue another request, the debugger in PhpStorm becomes active and you can step through the code and inspect the contents of variables:
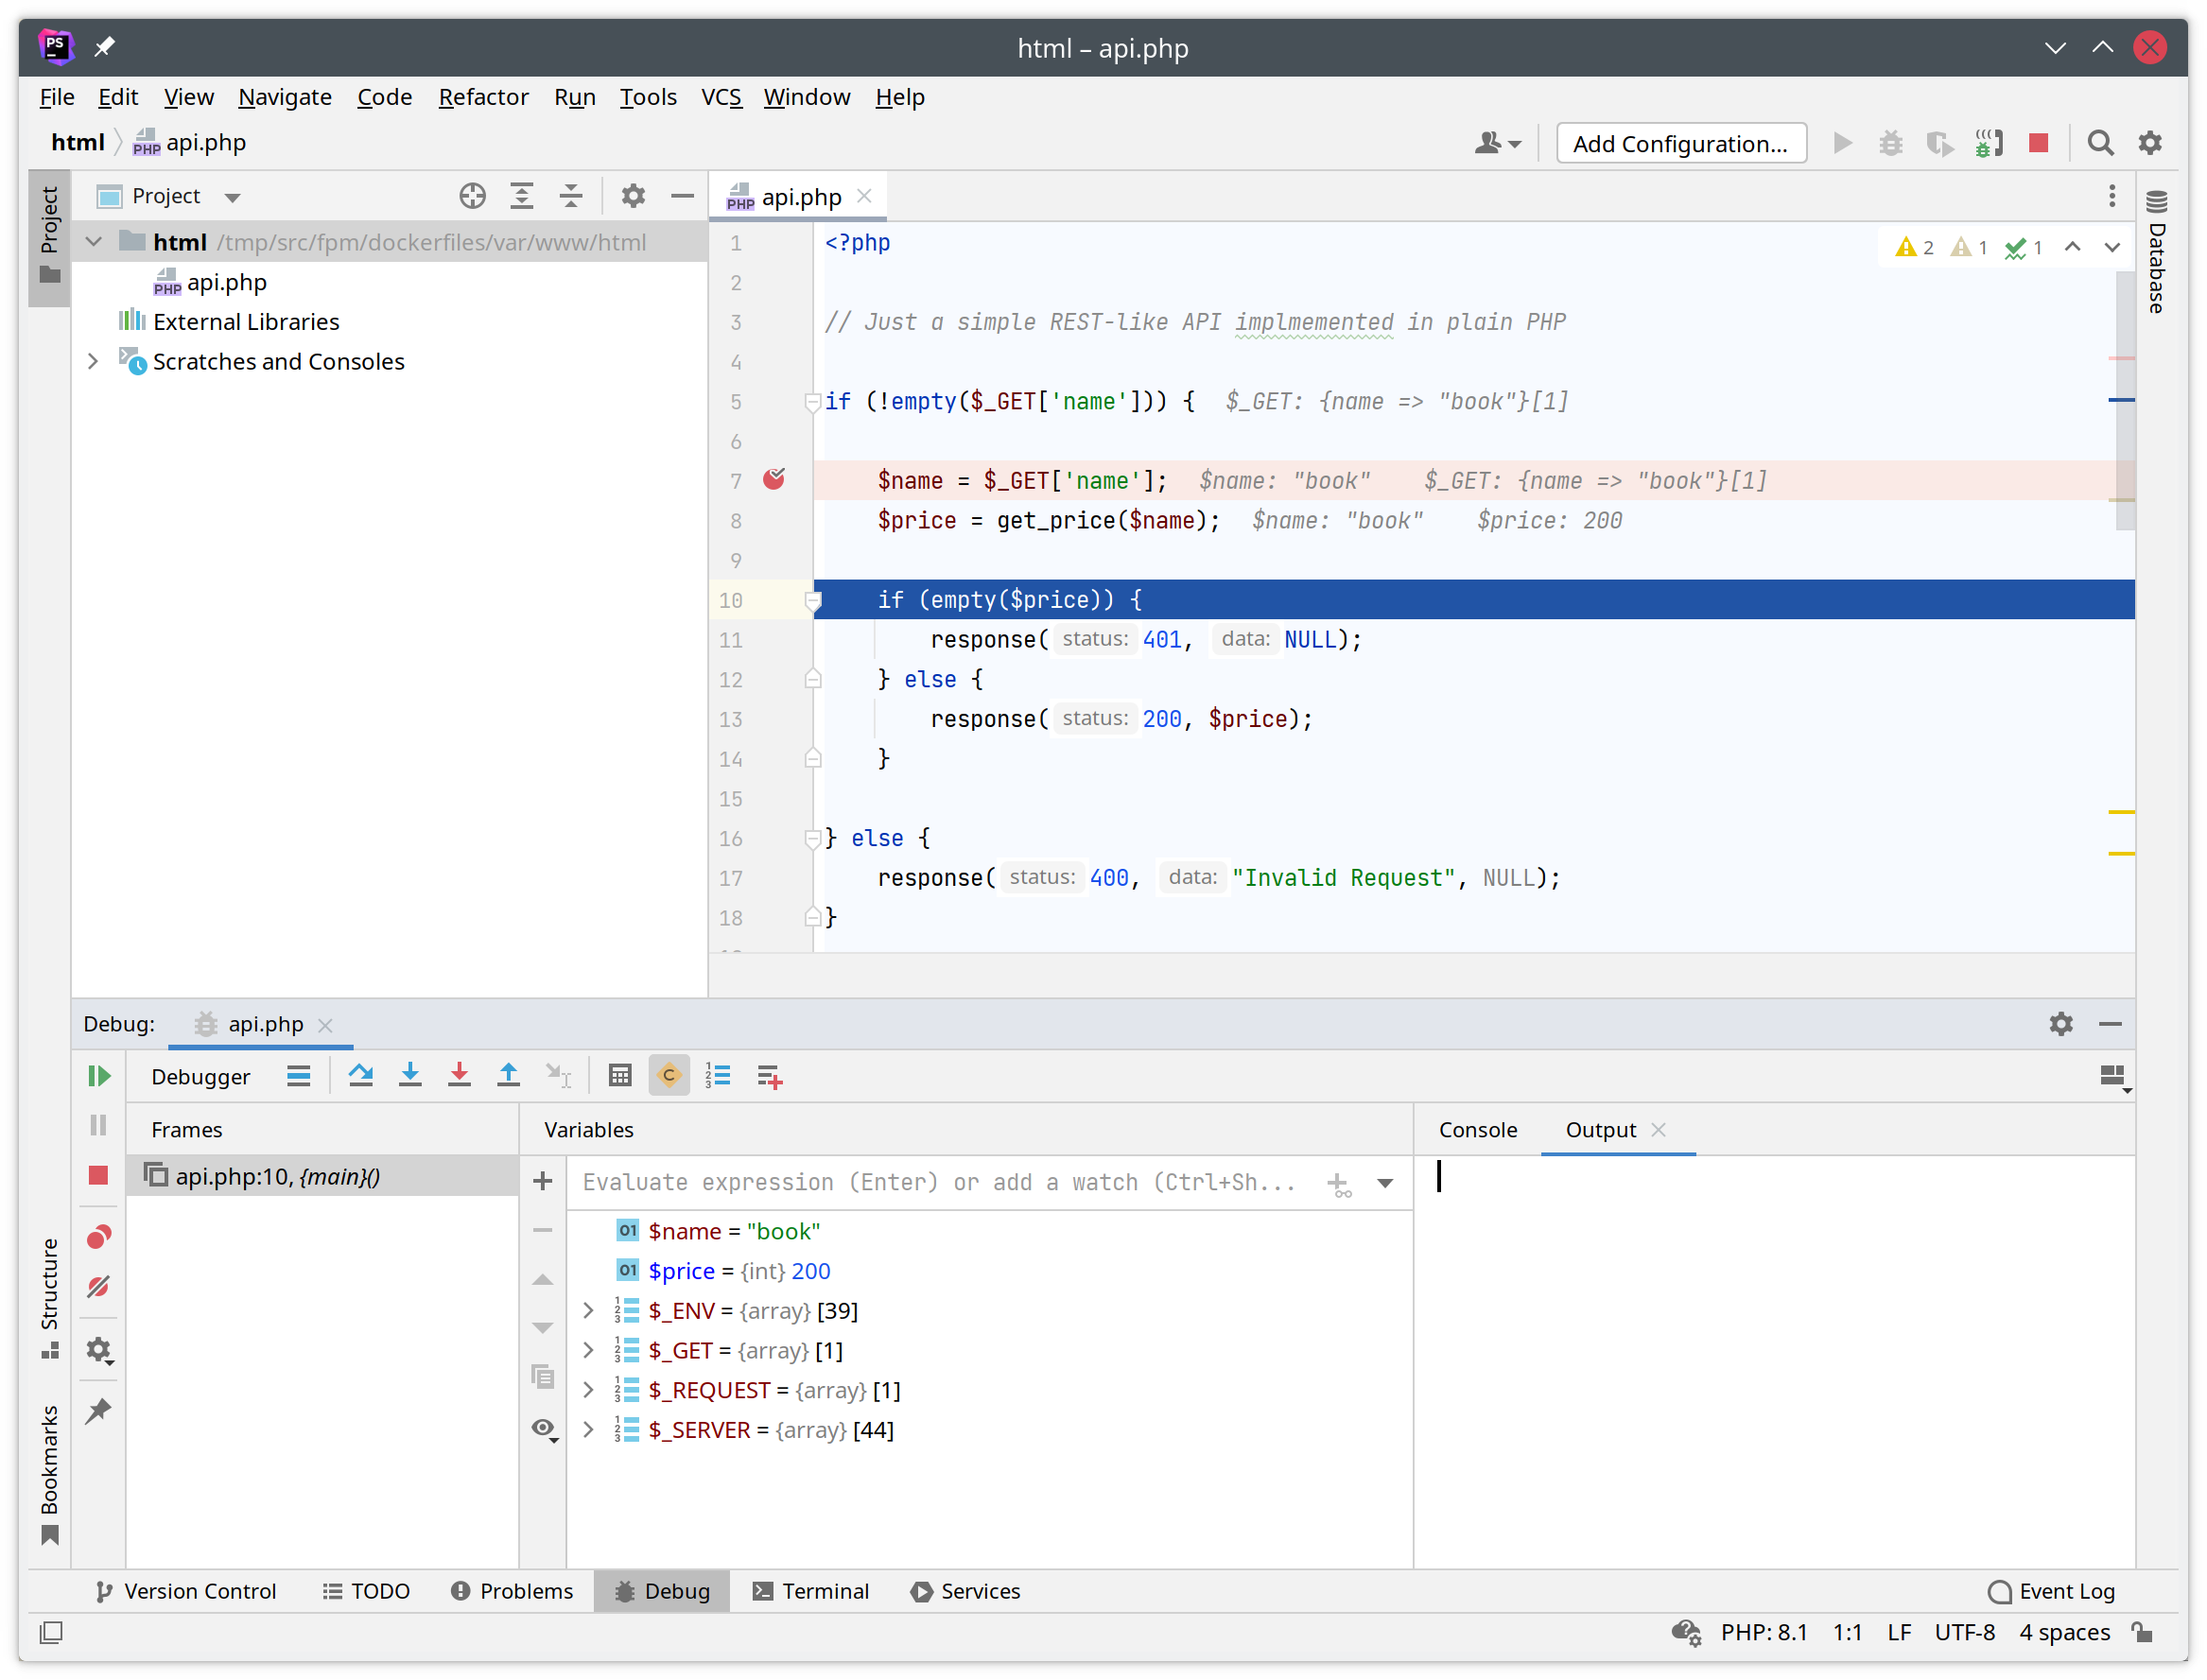
Debugging.
About Netcup (advertisement)
The German host Netcup offers, among other things, affordable and powerful web hosting packages, KVM-based root servers and dedicated servers. With our voucher codes you can save even more (6€ off your first order, 30% off all KVM-based root servers, ...).